Source code in MATLAB
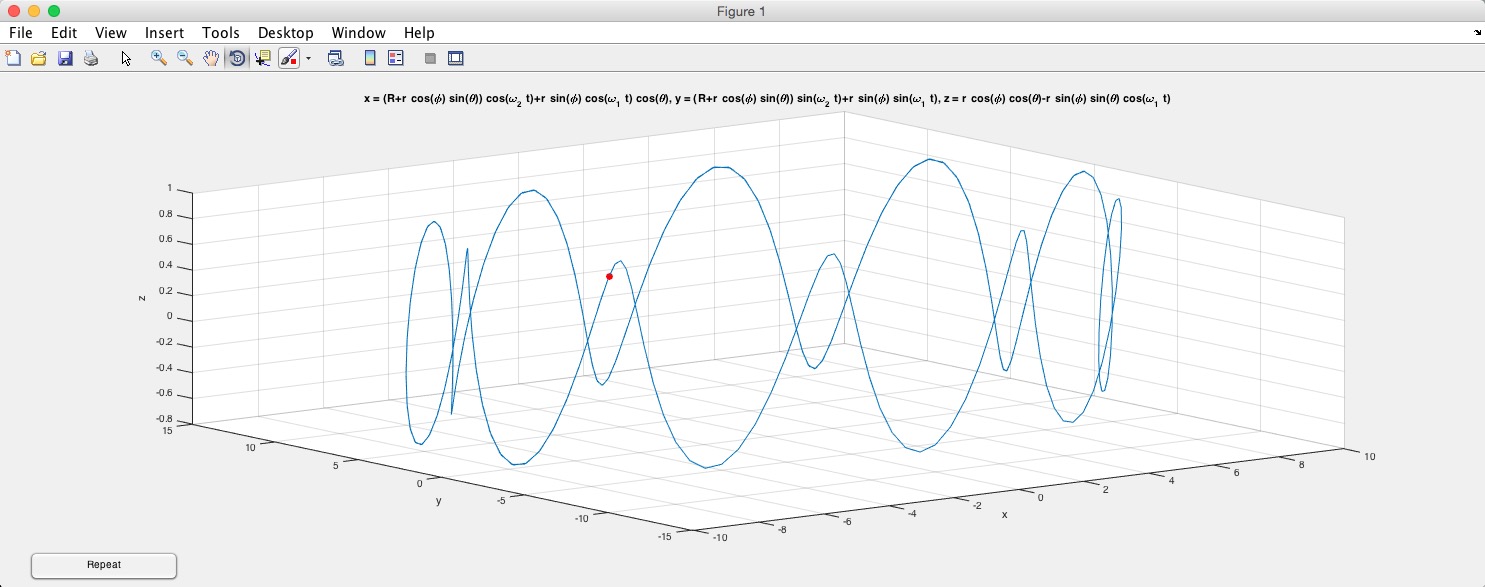
clf
R=1000;r=1;phi=45;theta=5;omega1=1;omega2=0.023;
%%%phi/theta are inclination of precession
%%%and self_rotation respectively, omega1/2 are angular velocity of
%%%self_rotation and free_precession respectively
x=@(t)(R+r*cosd(phi)*sind(theta))*cosd(omega2*t)+r*sind(phi)*cosd(omega1*t)*cosd(theta);
y=@(t)(R+r*cosd(phi)*sind(theta))*sind(omega2*t)+r*sind(phi)*sind(omega1*t);
z=@(t)r*cosd(phi)*cosd(theta)-r*sind(phi)*sind(theta)*cosd(omega1*t);
ezplot3(x,y,z,[0,1000],'animate')
The simulation result
The problems merit further research
- what’s the relationship between precession radius R and the profile of binary system?
- How to demodulate this signal with free-procession by HHT analysis?
- For specific value of parameters, the signal has been found a drift of peak, does it have something to do with QPO?
